Student inter-evaluation with R and cryptpad
I just gave a software vulnerability course where I made the students work in groups on a CVE (understand how it works, how to exploit it, how to reproduce the exploit, how it has been fixed, how to know if a system is exposed, how to fix an exposed system…). The students presented their work to the other groups and I wanted to experiment on the evaluation of the presentation. Instead of just giving a grade based on my opinion, I wanted to gather the opinion of all the students in the audience and to somehow agregate their opinions into a grade.
While the questionnaire I did to gather the students’ opinion was a bit naive and not very interesting, the tools I used to do this can be interesting if one wants to try something similar so I share it here.
Tools used
I used CryptPad to create questionnaires that students can fill to evaluate the work of other students. CryptPad is an open-source (AGPL-3.0) web-based office suite. In particular, CryptPad’s Form tool enables to create questionnaires that can be completed by people, and you can very easily obtain exploitable CSV data once it has been completed.
I used R + tidyverse to manipulate data, to grade students and to visualize results.
Base questionnaire
First, I created a base questionnaire used to evaluate a presentation.
I wanted students to self-evaluate their understanding of a vulnerability just after it has been presented.
I wanted students to evaluate the quality of the presentation itself.
I used ordinal scales with special values to detect whether something important was missing in a group’s presentation.
I used CryptPad’s Choice Grid to make this convenient.
Here are screenshots of the interface that enables to create polls.
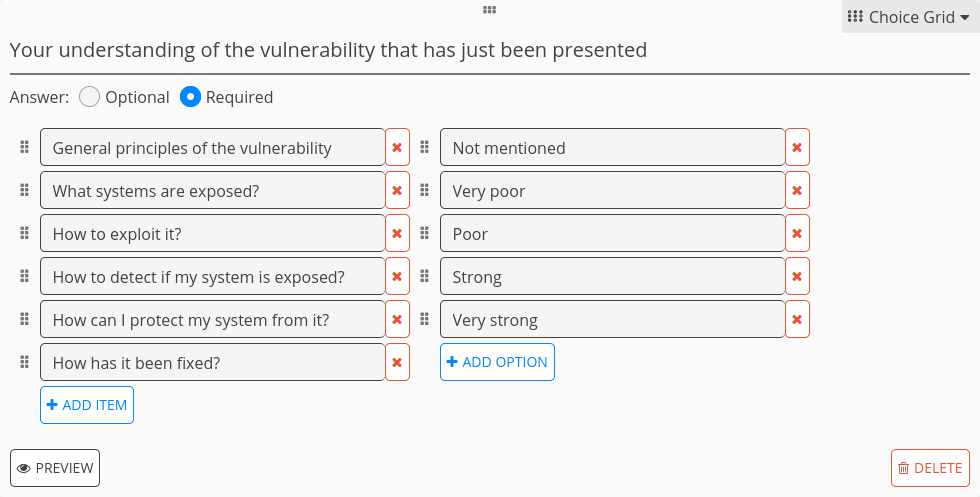
Question to let students self-evaluate their understanding of the vulnerability.
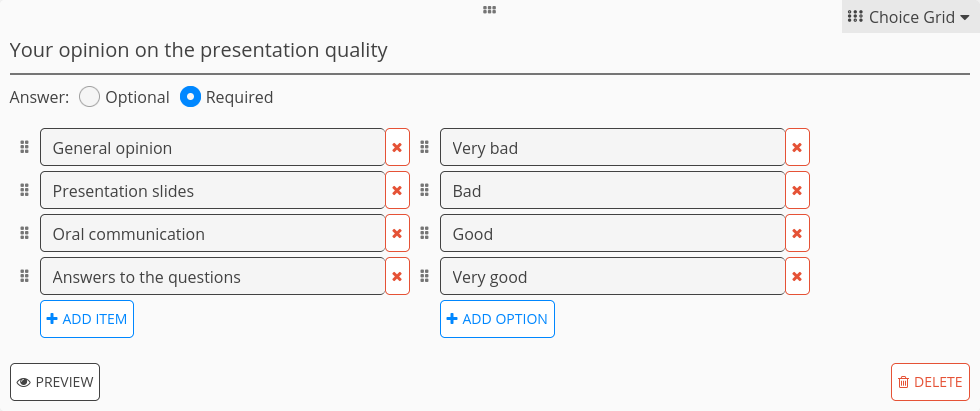
Question to let students inter-evaluate the quality of the presentation.
And here is the interface used to fill the questionnaire.
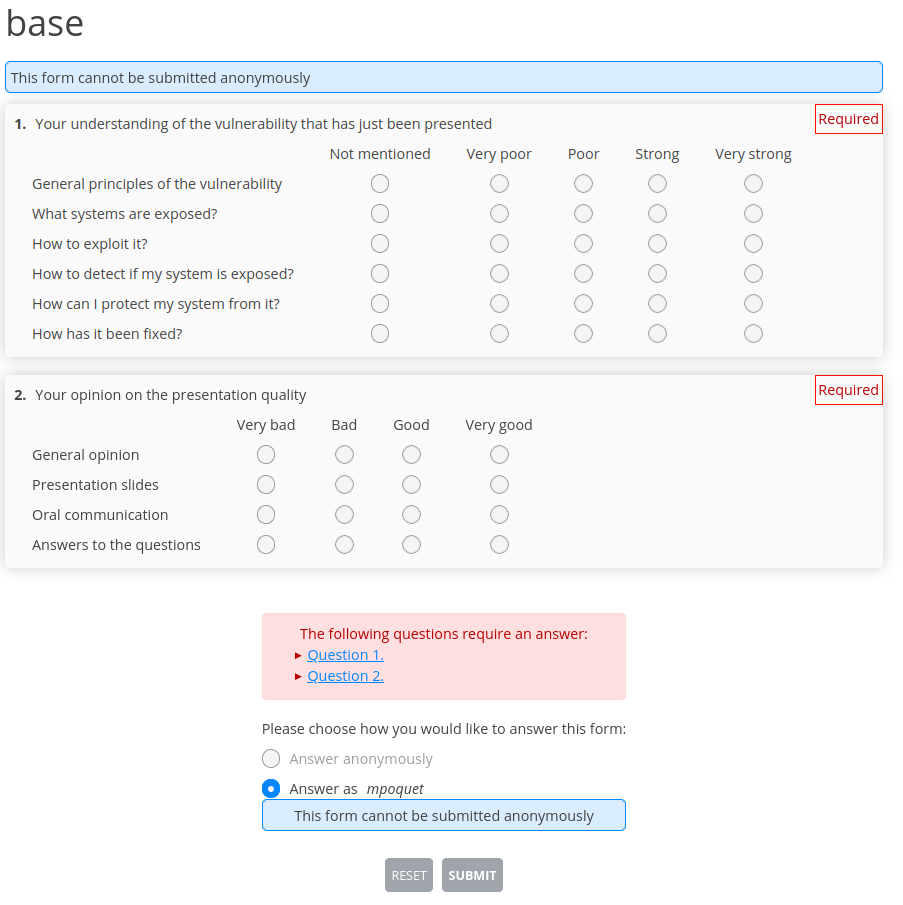
Interface to fill the questionnaire (used by students (and teacher))
I then created a copy of the base file for each group. This can be done from CryptPad’s Drive interface (Drag and drop or Right Click + Make a copy).
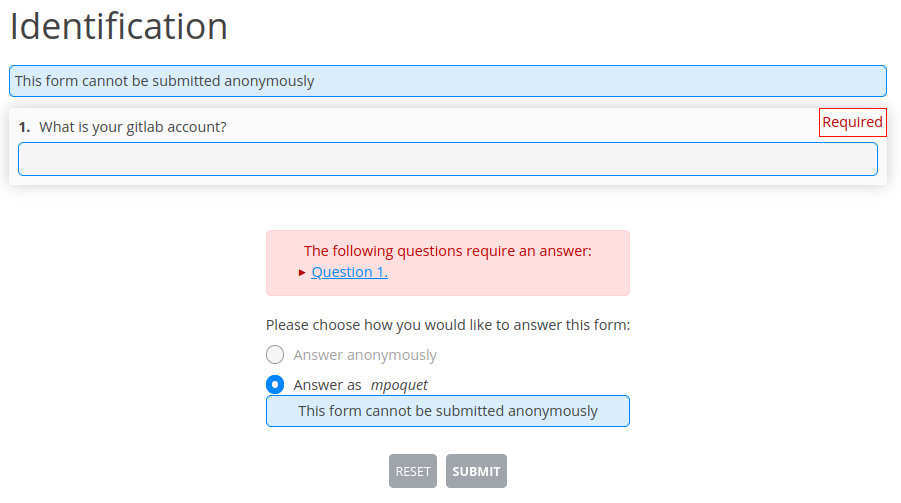
Identification questionnaire
Data gathered from CryptPad are identified by CryptPad user name. I created a questionnaire to associate this user name with the student identifier that I used for other tests (their GitLab account on the university’s GitLab instance).
Workflow
Presentations were done in sequence during the same course time slot.
I made the students fill the identification questionnaire at the beginning of the time slot (before the presentations).
I saved the gathered data on my disk by clicking on the Export to csv button on the Poll’s Responses tab.
I then asked the audience of each presentation to pre-fill the questionnaire during the presentation, and to complete it just after the end of the presentation (I gave them a bunch of minutes). I saved the gathered data of each presentation once all the students have filled the questionnaire.
List of involved data files
Here are the various data files involved in this analysis.
identification.csv, obtained from the Identification questionnaire.¶Time,Participant,What is your gitlab account?
2022-06-23T08:51:26.234Z,mpoquet,mpoquet
2022-06-23T09:01:00.000Z,superman,johndoe
2022-06-23T09:02:00.000Z,ohko,janedoe
2022-06-23T09:03:00.000Z,fred,fmolas
2022-06-23T09:03:00.000Z,seb,srassiat
cve-pwnkit.csv for the group that presented PwnKit. Obtained from each questionnaire duplicated from the Base questionnaire.¶Time,Participant,Your understanding of the vulnerability that has just been presented | General principles of the vulnerability,Your understanding of the vulnerability that has just been presented | What systems are exposed?,Your understanding of the vulnerability that has just been presented | How to exploit it?,Your understanding of the vulnerability that has just been presented | How to detect if my system is exposed?,Your understanding of the vulnerability that has just been presented | How can I protect my system from it?,Your understanding of the vulnerability that has just been presented | How has it been fixed?,Your opinion on the presentation quality | General opinion,Your opinion on the presentation quality | Presentation slides,Your opinion on the presentation quality | Oral communication,Your opinion on the presentation quality | Answers to the questions
2022-06-23T09:15:00.000Z,mpoquet,Very strong,Very strong,Very strong,Very strong,Very strong,Very strong,Good,Very good,Very good,Good
2022-06-23T09:15:10.000Z,superman,Very strong,Very strong,Very strong,Very strong,Very strong,Very strong,Very good,Very good,Very good,Very good
2022-06-23T09:15:10.000Z,ohko,Very poor,Very poor,Very poor,Very poor,Very poor,Very poor,Very bad,Very bad,Very bad,Very bad
group-members.csv associates students to groups (+teacher for convenience’s sake). Manually written.¶group,gitlab_account
teacher,mpoquet
pwnkit,fmolas
pwnkit,srassiat
log4shell,johndoe
log4shell,janedoe
Analysis with R
Here is the code I used to analyze the data from all the presentations.
The script starts by importing tidyverse, then creates types to represent the ordinal scales.
#!/usr/bin/env Rscript
library(tidyverse)

understanding_vec = c('Not mentioned', 'Very poor', 'Poor', 'Strong', 'Very strong')
quality_vec = c('Very bad', 'Bad', 'Good', 'Very good')

col_understanding = col_factor(levels=understanding_vec, ordered=TRUE)
col_quality = col_factor(levels=quality_vec, ordered=TRUE)
Evaluation files for each groups are read separately, then put in a single dataframe.
I used readr::spec to generate a basic cols specification.
eval_cols = cols(
  `Time` = col_datetime(format = ""),
  `Participant` = col_character(),
  `Your understanding of the vulnerability that has just been presented | General principles of the vulnerability` = col_understanding,
  `Your understanding of the vulnerability that has just been presented | What systems are exposed?` = col_understanding,
  `Your understanding of the vulnerability that has just been presented | How to exploit it?` = col_understanding,
  `Your understanding of the vulnerability that has just been presented | How to detect if my system is exposed?` = col_understanding,
  `Your understanding of the vulnerability that has just been presented | How can I protect my system from it?` = col_understanding,
  `Your understanding of the vulnerability that has just been presented | How has it been fixed?` = col_understanding,
  `Your opinion on the presentation quality | General opinion` = col_quality,
  `Your opinion on the presentation quality | Presentation slides` = col_quality,
  `Your opinion on the presentation quality | Oral communication` = col_quality,
  `Your opinion on the presentation quality | Answers to the questions` = col_quality
)

presentation1 = read_csv('cve-pwnkit.csv', col_names=TRUE, col_types=eval_cols) %>% mutate(group="pwnkit")
presentation2 = read_csv('cve-log4shell.csv', col_names=TRUE, col_types=eval_cols) %>% mutate(group="log4shell")
# ...
presentations = bind_rows(
  presentation1
 ,presentation2
#,...
)
Columns names are very long in the evaluation CSV files so I shortened them.
# Shorten the column names
presentations = presentations %>% rename(
  `General principles of the vulnerability` = `Your understanding of the vulnerability that has just been presented | General principles of the vulnerability`,
  `What systems are exposed?` = `Your understanding of the vulnerability that has just been presented | What systems are exposed?`,
  `How to exploit it?` = `Your understanding of the vulnerability that has just been presented | How to exploit it?`,
  `How to detect if my system is exposed?` = `Your understanding of the vulnerability that has just been presented | How to detect if my system is exposed?`,
  `How can I protect my system from it?` = `Your understanding of the vulnerability that has just been presented | How can I protect my system from it?`,
  `How has it been fixed?` = `Your understanding of the vulnerability that has just been presented | How has it been fixed?`,
  `General opinion` = `Your opinion on the presentation quality | General opinion`,
  `Presentation slides` = `Your opinion on the presentation quality | Presentation slides`,
  `Oral communication` = `Your opinion on the presentation quality | Oral communication`,
  `Answers to the questions` = `Your opinion on the presentation quality | Answers to the questions`
)
Participants in the evaluation are then identified, which enables to filter wrong data. In my real data, some students evaluated their own group and I wanted to exclude this from my analysis.
# Identify questionnaire participants to students/teacher
identification = read_csv('identification.csv') %>% rename(gitlab_account = `What is your gitlab account?`) %>% select(-Time)
group_members = read_csv('group-members.csv') %>% rename(participant_group = group)

identified_presentations = left_join(
  presentations,
  inner_join(
    identification,
    group_members,
    by="gitlab_account"
  ),
  by=c("Participant")
)

# Some students evaluated their own group and I did not want to use such data.
presentations_no_selfgroup_eval = identified_presentations %>% filter(group != participant_group)
In my real evaluation, all groups did not have the same size. I planned to use the median opinion to grade students, so I computed how many participants were involved in the evaluation of each group to visualize the median opinion line.
# Compute how many participants evaluated each group
participants_per_group = presentations_no_selfgroup_eval %>%
  group_by(group) %>%
  summarize(nb_participants = n_distinct(Participant)) %>%
  mutate(
    nb_participants_median = nb_participants/2,
    linetype = 'Median Opinion',
  )
Here is a visualization script of the self-assessment of the participants understanding, for each group presentation. I used tidyr::pivot_longer to make the data in the format expected for stacked bar charts.
# Data must be reshaped to fit what stacked bar charts expect
understanding_pivoted = presentations_no_selfgroup_eval %>% select(
  -`General opinion`,
  -`Presentation slides`,
  -`Oral communication`,
  -`Answers to the questions`
  ) %>% pivot_longer(cols=3:8, names_to="Question", values_to="Answer")

understanding_plot = understanding_pivoted %>% ggplot() +
    geom_bar(aes(Question, fill=Answer)) +
    facet_wrap(vars(group)) +
    geom_hline(data=participants_per_group, aes(yintercept=nb_participants_median, linetype=linetype)) +
    coord_flip() +
    theme_bw() +
    labs(x="", y="Number of partipants that have each opinion") +
    theme(legend.position="top", legend.title=element_blank())
Here is a very similar visualization script for the inter-evaluation of the quality of each group presentation.
quality_pivoted = presentations_no_selfgroup_eval %>% select(
  -`General principles of the vulnerability`,
  -`What systems are exposed?`,
  -`How to exploit it?`,
  -`How to detect if my system is exposed?`,
  -`How can I protect my system from it?`,
  -`How has it been fixed?`
  ) %>% pivot_longer(cols=3:6, names_to="Question", values_to="Answer")

quality_plot = quality_pivoted %>% ggplot() +
    geom_bar(aes(Question, fill=Answer)) +
    facet_wrap(vars(group)) +
    geom_hline(data=participants_per_group, aes(yintercept=nb_participants_median, linetype=linetype)) +
    coord_flip() +
    theme_bw() +
    labs(x="", y="Number of partipants that have each opinion") +
    theme(legend.position="top", legend.title=element_blank())
On my real data, this is how the visualizations looked like (Text/values are in French).

Visualization of the self-assessment understanting data.

Visualization of the inter-evaluation quality data.
I originaly planned to use the median value to grade the students (thanks to missMethods::median), but the students greatly overestimated the quality of the presentation in my opinion so I used an average instead. To do so I used dplyr::mutate with dplyr::recode to associate a numeric value to each ordinal value, then just used an average on the General opinion values to grade the whole presentation.
# Grade each group
group_grades = presentations_no_selfgroup_eval %>% mutate(
    grade = recode(`General opinion`,
      'Very bad' = 0,
      'Bad' = 6,
      'Good' = 14,
      'Very good' = 20
    )
  ) %>% group_by(group) %>% summarize(
    project_presentation_grade = round(mean(grade), digits=2)
  )
A much more complex grading function can of course be used, for example by:
Using more data than the General opinion values.
Using a weighted average by giving a weight to each Participant. For example giving a stronger weight to the teacher can make sense. The weight of the students can be the same for all students or depend on some value, for example on the grade of another test meant to evaluate their expertise level.
Last words
This experiment was interesting but next time I would like to design a more elaborate test to evaluate the overall work of each group rather than just their presentations. I think that properly evaluating how each student understood the topic of each presentation (here, CVEs) after all the presentations would be useful. It would enable to grade the work of each group depending on how they understood the specific topic they worked on, but also depending on how well this knowledge was shared with other groups (since usable data about how well each student understood each topic would be available).